Tape Diagram

A tape diagram is a drawing of a math problem as a long strip split into equal or unequal parts, so you can see how the numbers relate. Pick part-whole, compare, ratio or equal groups, enter your numbers, and Print Pail draws the tape and prints a worksheet.
Worked example: a ratio tape diagram
The ratio of red beads to blue beads is 3 : 2, and there are 60 beads in all. Draw 3 + 2 = 5 equal boxes: 3 shaded for red and 2 for blue. The whole tape is 60, so one box is 60 ÷ 5 = 12. Red is 3 × 12 = 36 and blue is 2 × 12 = 24, and 36 + 24 = 60 checks the answer. In the tool, choose “Ratio with a total”, enter 3, 2 and 60, and tick “Show the answer”.
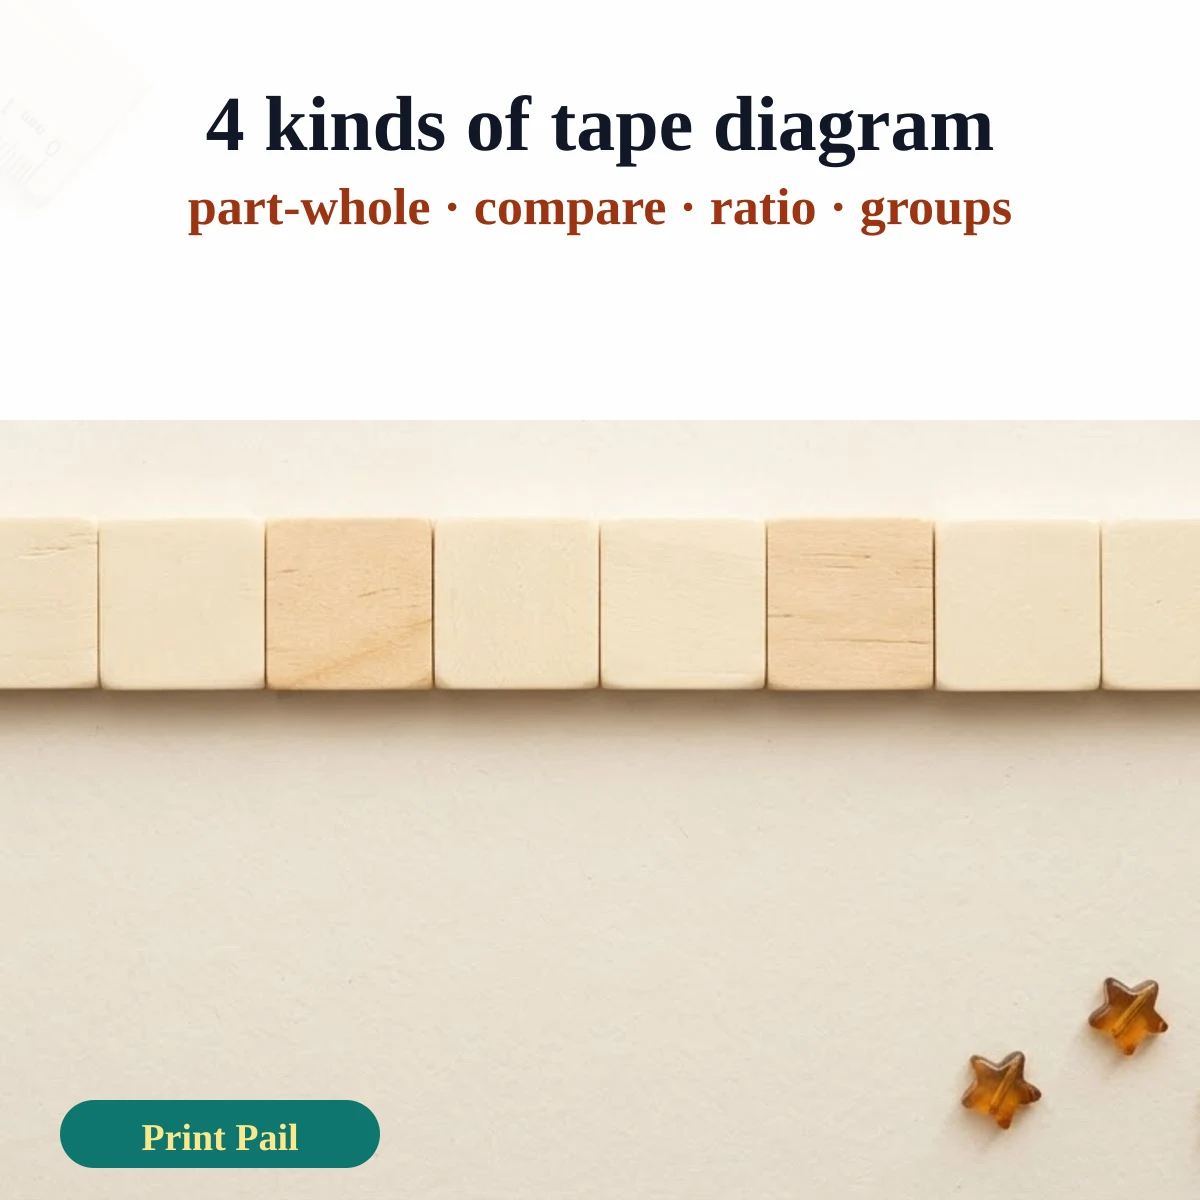
The four kinds of tape diagram
- Part + part = total: 12 red pens and 8 blue pens. One tape in two parts, 12 and 8, with a bracket marked “?” above it: 12 + 8 = 20.
- Compare two amounts: 15 stickers and 9 stickers. Two tapes, one under the other; the extra length is the difference: 15 − 9 = 6.
- Ratio with a total: 3 : 2 and 60, as in the example above.
- Equal groups: 4 rows of 7 books. One tape with 4 equal boxes of 7: 4 × 7 = 28.
Fractions and percents on a tape
A tape also shows a fraction of a number. For 3/4 of 24, split the tape into 4 equal boxes of 24 ÷ 4 = 6 and shade 3 of them: 3 × 6 = 18. For 25% of 80, split the tape into 4 equal boxes of 20, because 25% is one quarter, and one box is 20. For more practice with parts of a whole, see the fractions worksheets.
How to print and use the worksheet
- Choose the kind of problem and type the numbers; the tape redraws at once.
- Print once with the answer hidden for students and once with “Show the answer” ticked for the teacher copy.
- Set the print scale to 100% (Actual size), on Letter or A4, portrait or landscape.
- Ask students to use the “Your turn” boxes at the bottom to write a problem of their own and draw its tape.
These sheets are practice aids, not a curriculum; see the disclaimer. Back to Coloring Pages Free Printable for more printables.
Frequently asked questions
What is a tape diagram?
A tape diagram is a rectangular strip, divided into parts, that shows the numbers in a word problem and how they fit together. It is also called a bar model or strip diagram.
How do you draw a tape diagram for a ratio?
Draw one equal-sized box for each unit of the ratio, such as 3 boxes for the first number and 2 for the second. The total goes above the whole tape, and dividing it by the number of boxes gives the value of one box.
How do you use a tape diagram to compare two numbers?
Draw two tapes, one under the other, with lengths in proportion to the numbers. The extra length on the longer tape is the difference, which you find by subtracting.
Are tape diagrams used in school standards?
Yes. The Common Core State Standards for Mathematics (2010) name tape diagrams as one way to reason about ratios in standard 6.RP.A.3, alongside double number lines and equations.
Was this page helpful?
Tell us what worked or what to fix. It takes ten seconds.
Thank you! Your note reached us.